IPEDS Guide
Tip: As of May 9, 2023 you can use new and improved lists, specifically designed for Higher Ed Analysis, to complete IPEDS reports. See the new guide at IPEDS Lists Guide for details and instructions.
This guide provides instructions for finding, exporting, and organizing data for the Integrated Postsecondary Education Data System (IPEDS) in Blackbaud Education Management. It will be updated as more filter options and features are added.
For more information and to download the current survey forms, visit the IPEDS page on the National Center for Education Statistics website.
12-Month Enrollment
The 12-Month Enrollment (E12) form requires you to report unduplicated headcounts, instructional activity, and full-time equivalent enrollment for a 12-month period from July 1 through June 30. The report is broken down by undergraduate vs. graduate enrollment and by demographic categories.
Steps 1 and 2 will help you fill out Part A - Unduplicated Count on the IPEDS report. Step 3 will help you fill out Part B - Instructional Activity.
Step 1: Create a student list
Start by creating a list that you can use to fill in Part A - Unduplicated Count on the IPEDS report.
1. In Academics, go to Scheduling and select Students list.
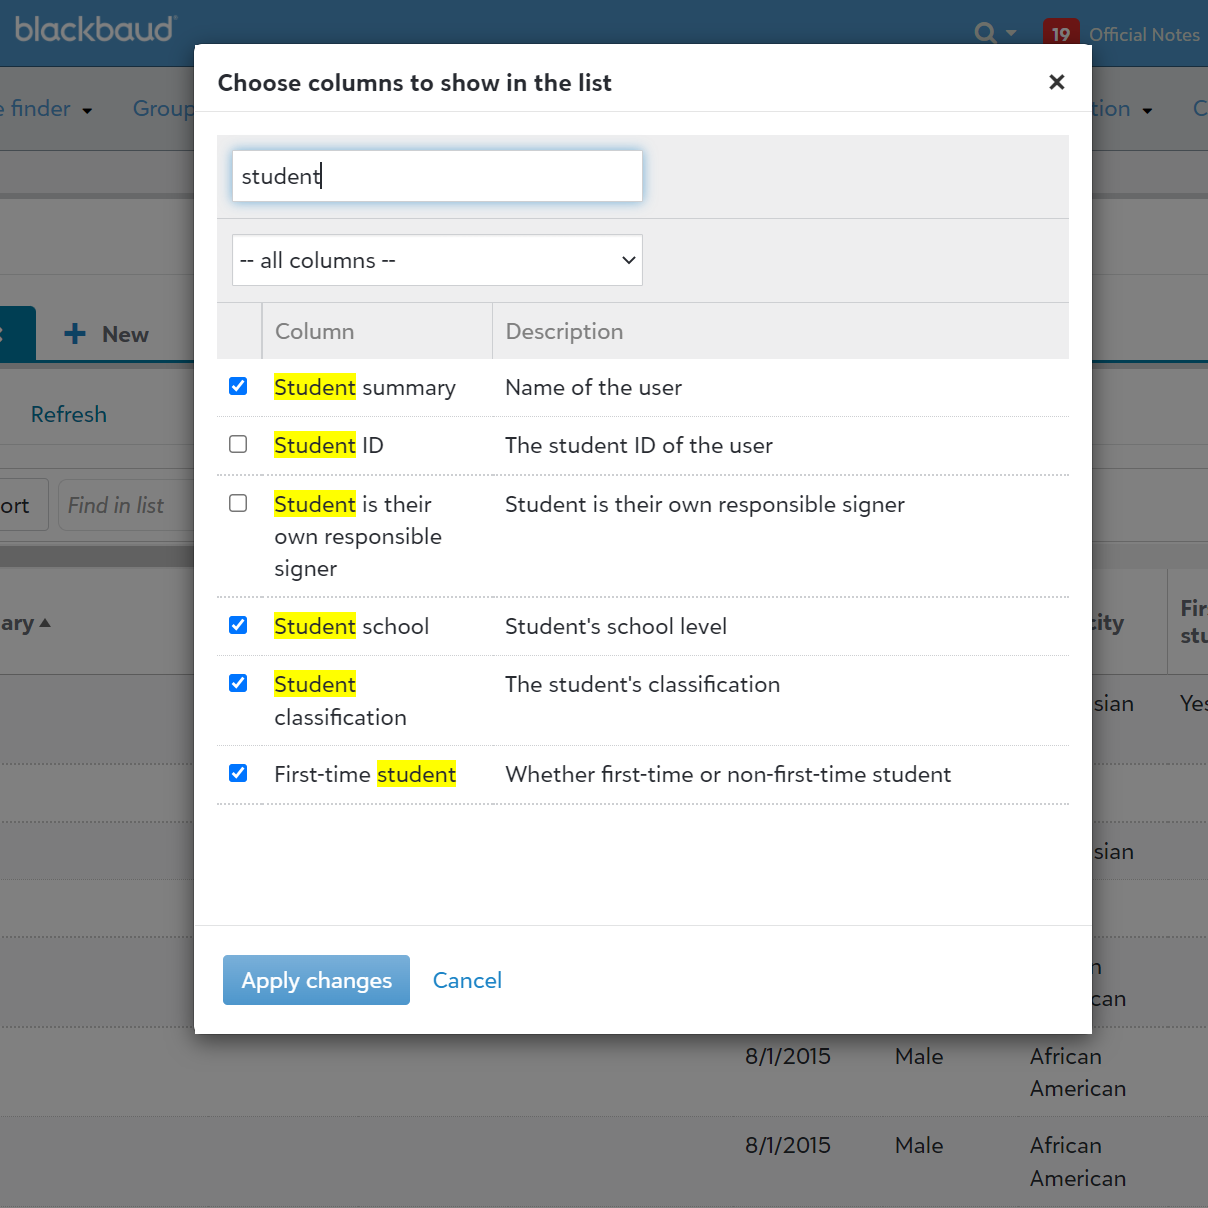
2. Select Columns. Check the following options (you can search for the column names by entering them in the search bar at the top):
-
Student summary
-
Graduation year
-
Gender
-
Ethnicity
-
Race
-
Is Latino/Hispanic
-
Citizenship
-
Student school (only relevant if your school has Graduate and Undergraduate levels)
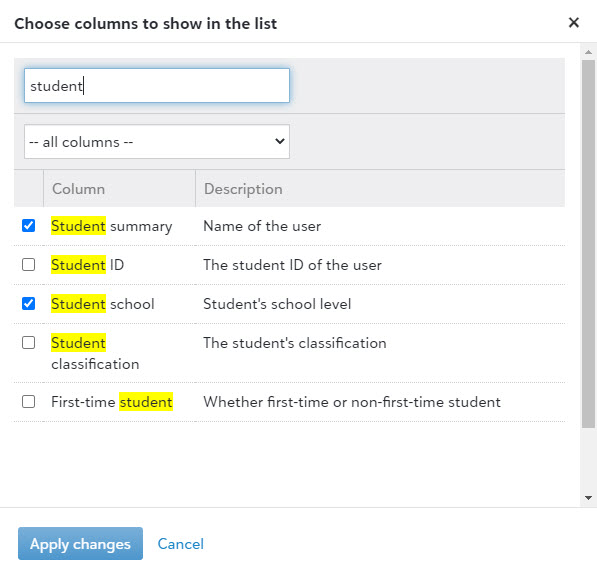
3. Select Apply changes.
4. To save this column view for future use, select Save and enter a name for the list. You can use this list view again to fill out IPEDS next year.
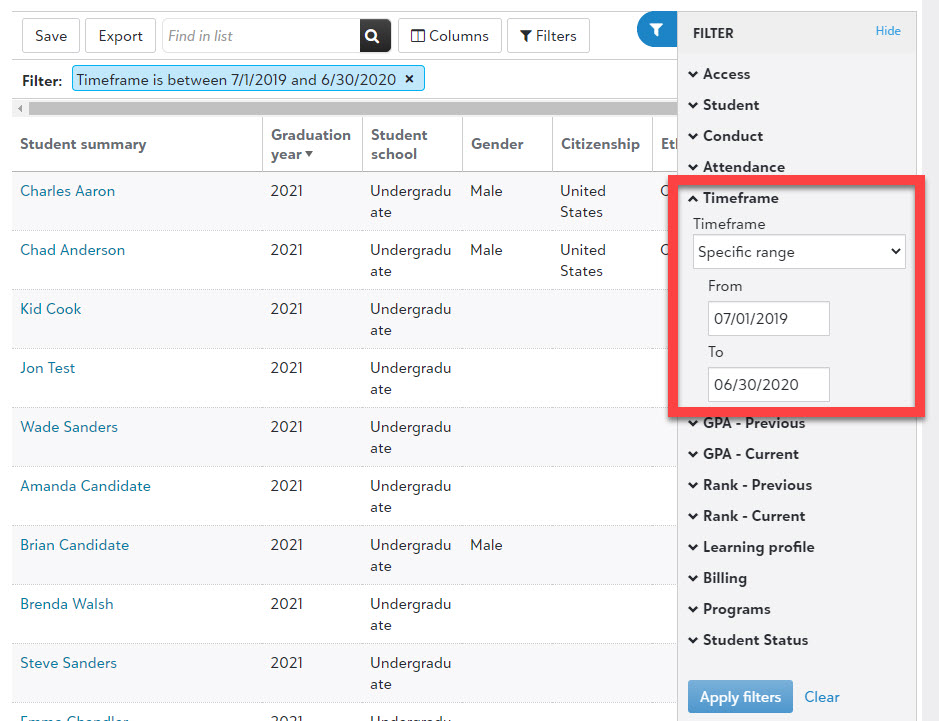
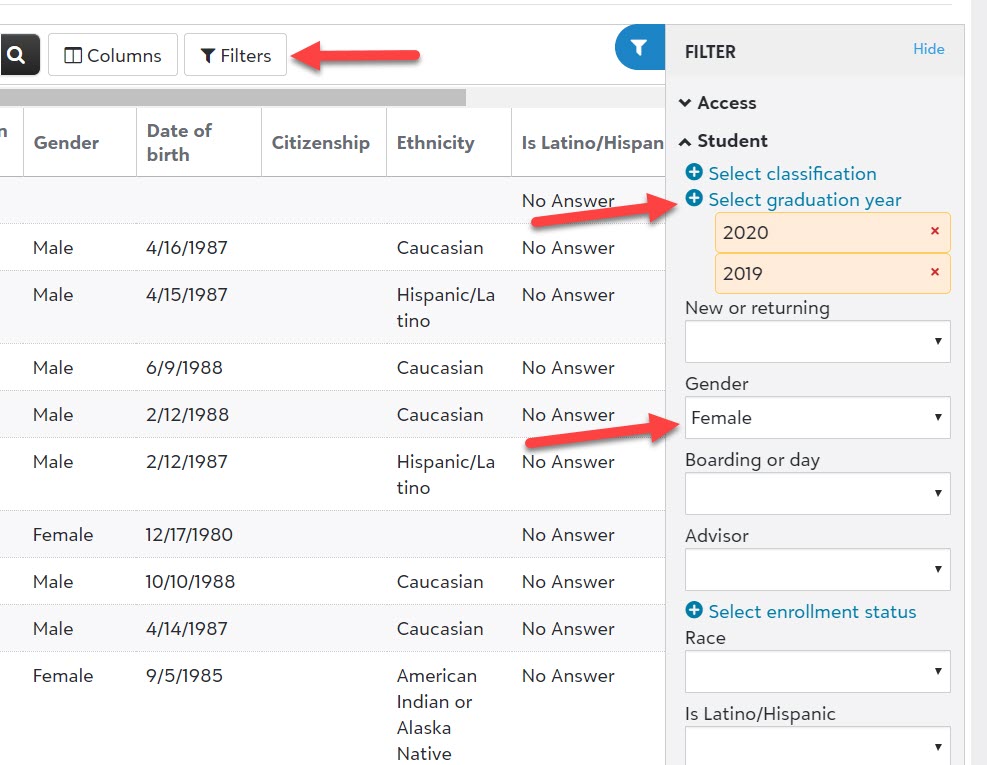
Step 2: Filter the student list
1. By default, the Only Current Student filter will be applied to your list. Since you will want to include students who graduated or left your school in the last year, remove this filter by selecting the X next to Role criteria is Only Current Student at the top of the list.
2. Select Filters.
|
3. Select the Timeframe heading under Filters, then use the dropdown menu to select Specific range. Enter the date range for the IPEDS report you are filling out in the From and To fields, either by using the calendar selector tool or typing the dates in the format MM/DD/YYYY. For example, if you are filling out the 12-Month Enrollment report in the fall of 2020, you would enter From 07/01/2019 and To 06/30/2020. |
|
4. Select Apply filters.
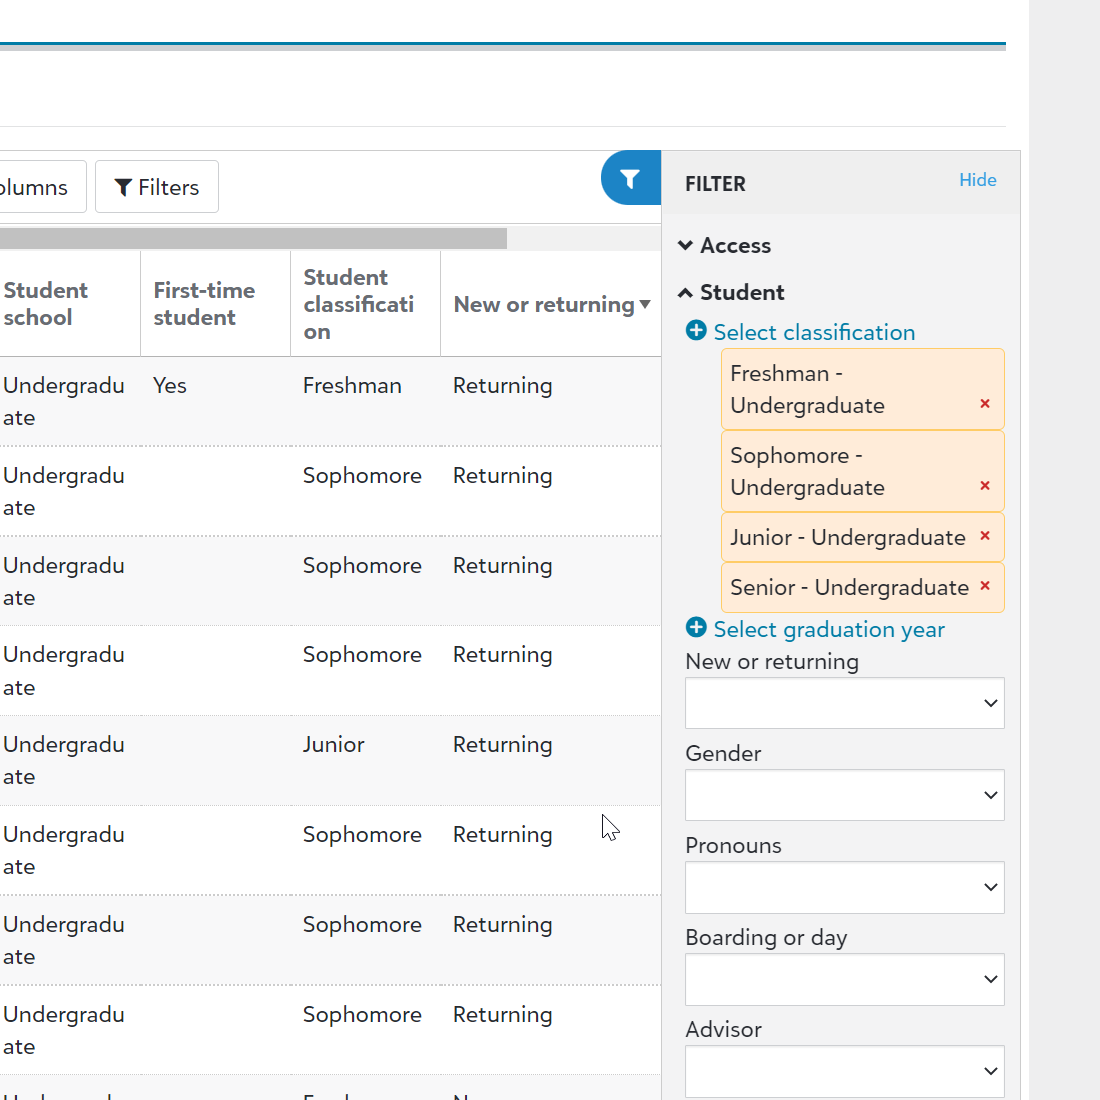
Take a look at the filtered list. Depending how your school handles student records, the list might still include some alumni who graduated or left the school prior to the relevant date range. If necessary, you can use other filters to remove false positives from the list. One option is to open the Filter menu again, expand the Student subheading, and choose + Select graduation year, then Apply filters again.
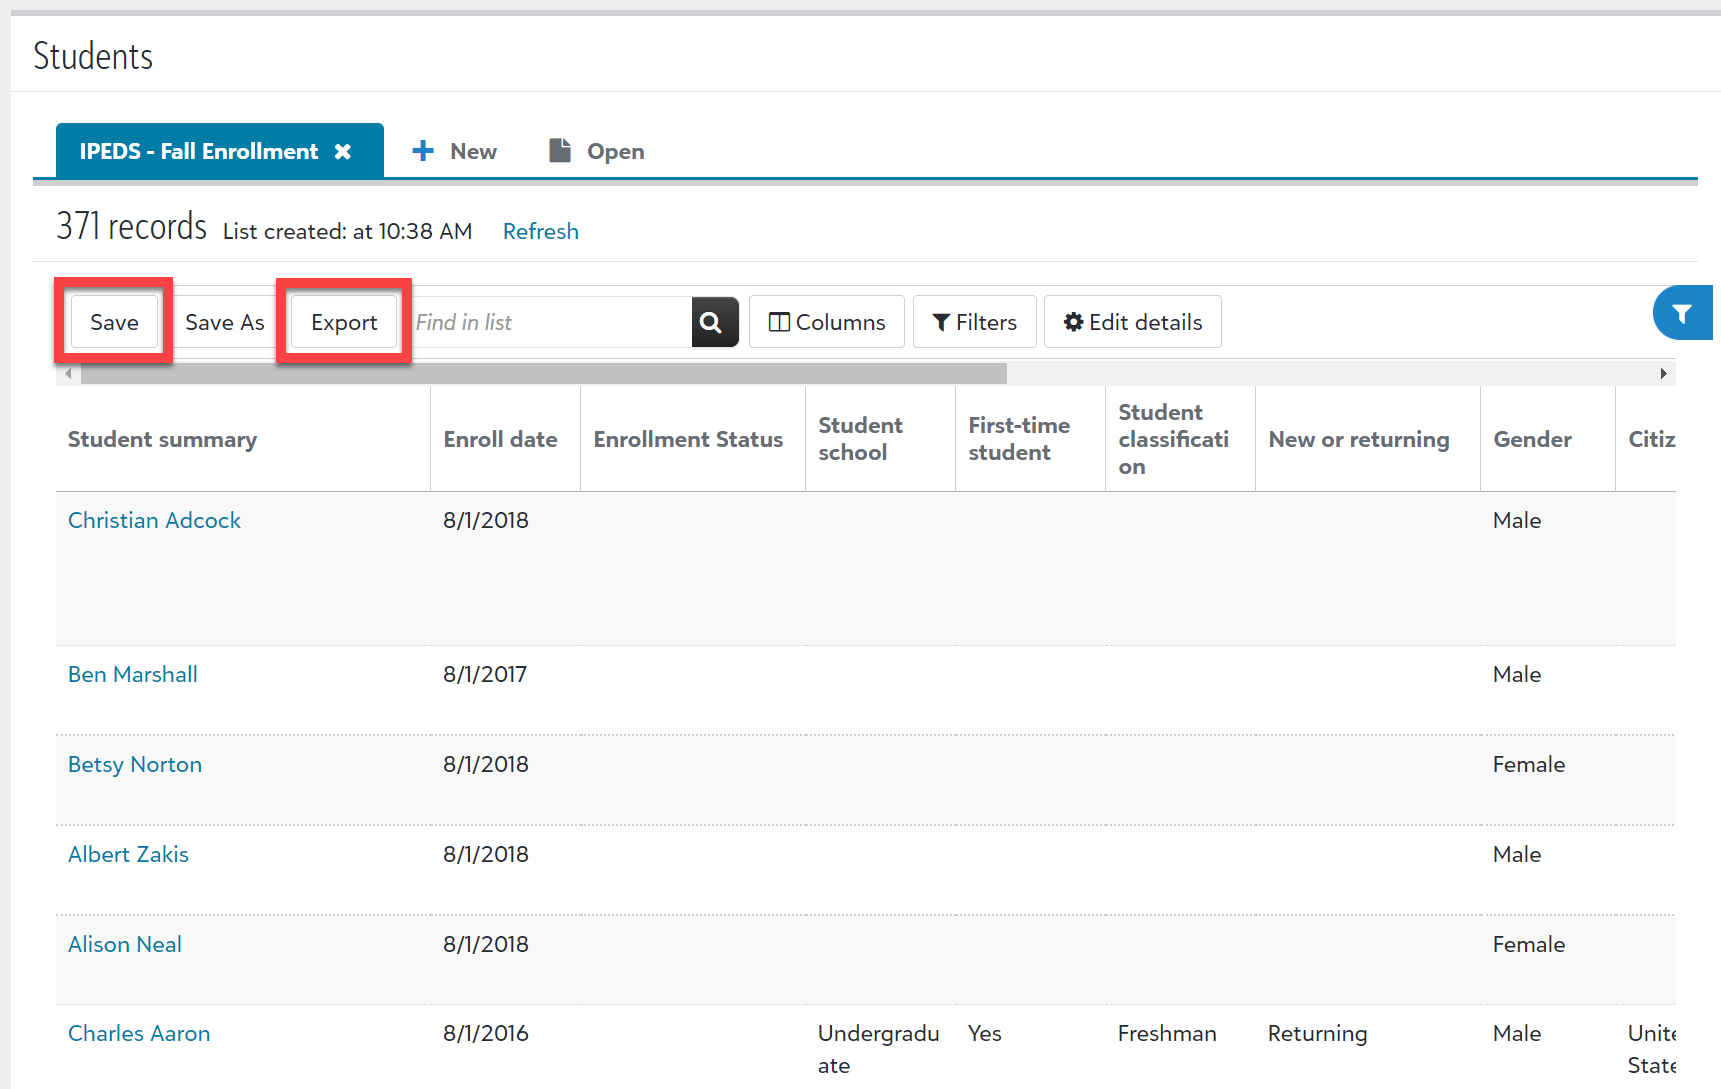
5. With this filtered list, you are ready to fill in Part A - Unduplicated Count on the IPEDS 12-Month Enrollment report. You can either work with the list in your web browser or select Export to download it as a CSV spreadsheet file, which you can view and filter in your own spreadsheet software.
Note: There is no single filter setting that will create a perfectly curated list for your school. As an administrator, you will have to use your own knowledge of the student body to remove false positives and account for non-credit-seeking students (who are not counted in the IPEDS report). You may also have to fill in gaps in knowledge depending on what categories of demographic data your school keeps in its records.
6. Either in the browser or in your spreadsheet software, use additional filters to fill in each of the fields on the Unduplicated Count form. For example, to fill in the number of Black male students enrolled for undergraduate credit, you could set the Gender filter to Male, set the Race filter to Black or African American, and count the number of Undergraduate students in the resulting list.
Note: Refer to the IPEDS documentation for guidance on reconciling gender counts to overall student totals.
Step 3: Generate course enrollment reports
Next, let's run some reports to help you fill out Part B - Instructional Activity.
Note: Before you begin filling out Part B, you will need to choose which Undergraduate Instructional Activity Type to report, as outlined on Page 2 of the IPEDS paperwork. Undergraduate instructional activity can be reported in units of clock hours or credit hours, while graduate-level instructional activity must be reported in credit hours. The NCES gives the following explanation on the two activity types:
"Clock hours are a unit of measure that represent an hour of scheduled instruction given to students. Credit hours are a unit of measure representing the equivalent of approximately one hour of instruction per week over the entire term. Select the method that best describes the units used to measure instructional activity at your institution."
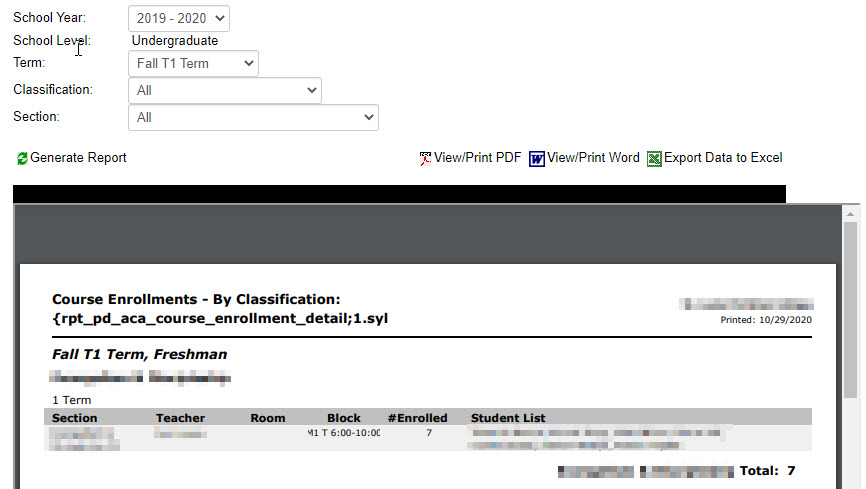
1. In Academics, go to Scheduling, then Course selection and schedules. Make sure you are in the Overview section.
2. Open the Reports dropdown menu and select Course Enrollment. This will open a new tab in your browser.
3. Select the relevant School Year for the IPEDS report. If your school has both undergraduate and graduate programs, start by choosing Undergraduate from the School Level menu.
4. Open the Term dropdown menu and select the earliest term that fell within the reporting window for the IPEDS report (remember that the report covers July 1 - June 30). You do not need to make any selections for Department or Section.
5. Select Generate Report. When the report appears, choose one of the export options (View/Print PDF, View/Print Word, or Export Data to Excel) to save the report to your device. You will use this report to calculate the "total activity" figure for the Instructional Activity section of Part B.
6. Return to the Term menu and select the next term that took place during the IPEDS reporting period. Repeat step 5. Repeat this step until you have generated and exported a report for each of the terms that took place during the reporting period.
7. If your school offers graduate or doctoral degrees, go to the School Level menu near the top of the report generator, select the appropriate school level, and select Generate Report again. Repeat steps 4-6 above to generate and save student enrollment reports for all of the relevant terms.
Step 4: Generate Courses list
If your school is choosing to report clock hour activity, you will need to consult your own records to determine how many clock hours students spent in each course. Consult the IPEDS 12-Month Enrollment website for additional help.
If your school is choosing to report credit hour activity, you might want to generate a Courses list to cross-reference as you make your calculations for Part B - Instructional Activity.
1. Go to Scheduling in the top menu and select Courses list.
2. Select Columns. Make sure that each of the following is selected:
-
Title
-
School level
-
Total credits
-
Status
3. Select Apply changes. You will now see a list of courses indicating the number of credit hours for each course.
4. Select Export to save the list as a CSV spreadsheet file on your device.
Step 5: Calculate instructional activity
You are now ready to run calculations and fill in to "total activity" fields on IPEDS 12-Month Enrollment Part B - Instructional Activity. Use one of the following formulas to calculate Clock hour activity or Credit hour activity, depending on which reporting method your school has chosen.
Note: The following explanations are taken from the IPEDS documentation provided by the NCES and are accurate as of Fall 2020. For further definitions and examples, see the 12-Month Enrollment Full Instructions at the end of your paperwork from the IPEDS Survey Materials website.
Also note that for the purposes of the IPEDS report, you are required to only report on students who are enrolled for credit. Students who are auditing a course, for example, will have to be excluded from your totals.
|
Clock hour activity Clock Hour Activity of a Course = Course Clock Hour Value * Number of Students Enrolled for Credit Clock Hour Value of a Course: The clock hour value of a course is the number of hours per week that the course meets multiplied by the number of weeks the course is given. For example, a 3-week real estate licensure course that meets 15 hours per week has a value of 45 clock hours. Number of Students Enrolled for Credit: The number of students enrolled for credit at the close of the official add period for each program. If there is no official add period, report as of the 15th day of each regular program, and the 5th day of each short program. Example Calculation: Total clock hour activity for Institution ABC. Institution ABC offers 3 courses during the July 1, 2019 - June 30, 2020 reporting period:
Compute the clock hour activity for each course:
Compute the total clock hour activity for the institution by summing the clock hour activity for all courses offered for credit that are measured in terms of clock hours:
|
Credit hour activity Credit Hour Activity of a Course = Course Credit Hour Value * Number of Students Enrolled for Credit Number of Students Enrolled for Credit: The number of students enrolled for credit at the close of the official add period for each term. If there is no official add period, report as of the 15th day of each regular term and the 5th day of each summer or short term. Example Calculation: Total credit hour activity for Institution DEZ. Institution DEZ offers 3 courses during the July 1, 2019 - June 30, 2020 reporting period:
Compute the credit hour activity for each course:
Compute the total credit hour activity for the institution by summing the credit hour activity for all courses offered for credit and measured in credit hours:
|
Admissions
The IPEDS Admissions (ADM) survey component collects basic information about the undergraduate selection process for first-time, degree- or certificate-seeking students entering in the fall term. This survey component is collected from institutions that do not have an open admissions policy for all or most entering first-time students.
For more information and step-by-step instructions on filling out the survey, see the IPEDS page on the National Center for Education Statistics website.
Step 1: Describe your admissions considerations
This step does not require any tools in Blackbaud Education Management. Select the option that best describes how your institution uses each admissions consideration (Secondary school GPA, Secondary school rank, etc.). Optionally, use the text box to provide additional context.
Step 2: Gather selection process data
Next, you will need to gather data on the numbers of applicants, admissions, and enrolled students, broken down by gender.
1. While logged in as an admissions manager, select Enrollment management from the persona menu.
2. Go to Admissions and select Candidates list.
3. By default, the Candidates list will display all candidates for the current admissions year. Select Filters to adjust these settings.
Under Candidate information, click + Select role criteria. Choose all relevant categories for your school (including Candidates, Past Candidates, Students, Past Students, and Alumni), then Select.
Click + Select entering year. Choose the year indicated on the IPEDS Admissions survey, then Select.
Scroll down and select Apply filters.
4. Select Columns. Select the following:
-
Candidate summary
-
Candidate status
-
Entering enrollment status
-
Gender
Select Apply changes.
5. You now have a list that you can use to fill out the Selection Process portion of the survey. Either use the list in your browser or Export it to open it in your spreadsheet software of choice.
Note: Refer to the IPEDS documentation for guidance on reconciling gender counts to overall student totals.
Step 3: Gather test score data
Consult with your school's admissions office for data onthe SAT and ACT scores of applicants.
Completions
Every fall, the IPEDS Completions survey collects the number of degrees and certificates awarded by field of study, award level, gender, age, and race/ethnicity. The reporting period covers the 12 months beginning July 1 of the previous calendar year and ending June 30 of the current calendar year.
For more information and step-by-step instructions on filling out the survey, see the IPEDS page on the National Center for Education Statistics website.
Step 1: Create a student list
1. In Academics, go to Scheduling and select Students list.
|
2. Select Columns. Check the following options:
|
|
3. Select Apply changes.
4. To save this column view for future use, select Save and enter a name for the list. You can use this list view again to fill out IPEDS next year.
Step 2: Filter the list
Note: This step is for smaller schools, generally with enrollments of 100 or fewer. If you are filling out IPEDS for a larger school, you may want to skip to Step 3.
One way to fill out your IPEDS Completions report is by applying Filters and sorting by columns. For example, to calculate the number of female students who earned an Associate’s Degree in CIP Code 3.4321, you would set the Gender filter to Female, set Degrees to Associate of Arts, and set Graduation year to the relevant graduation years.
|
1. Once you have set your filters, select Apply filters. 2. Sort the resulting table by the CIP Codes column and count the number of times the relevant CIP Code occurs. This is your count for the relevant demographic data, degree, and graduation year, which you can now enter into your IPEDS Completions form. |
Step 3: Export the list
If your school has a large number of students, you might want to export your search results to a CSV file and open it in your preferred spreadsheet application.
Select Export, and the file will appear in your downloads folder.
Here are a few tips on using your spreadsheet software to fill out the IPEDS Completions report. (Note: These instructions were written for Microsoft Excel, but other programs including Google Sheets have similar capabilities.)
-
Create a Pivot Table from your data to quickly calculate student counts. For example, to find the Ethnicity counts for each combination of CIP Code and Degree, you would click and drag Student Summary to the Values box, then add CIP Code, Degrees, Area of studies, and Ethnicity to the Rows box.
-
You are required to report the number of students completing each award level “By Age” for IPEDS. To find the ages of your students on their award dates, create a new column and label it Age at Degree. Then use a formula to calculate the student’s age based on the existing columns Date of Birth and Conferred on dates. For example, if Birthdate is in Column J and Conferred on Dates is in Column K, the formula might look like this:
=(K2-J2)/365.25
(The additional .25 in the denominator is to account for leap years.)
Click and drag the corner of this cell to apply it to all of the rows beneath it. Then sort the Age at Degree column data into the age ranges requested on the IPEDS paperwork (Under 18, 18-24, 25-39, 40 and Above, and Age Unknown).
Fall Enrollment
The Fall Enrollment component of the IPEDS survey collects student enrollment data including level of student, enrollment status, gender, and race/ethnicity. Different schools may be required to submit different data depending on whether the school is 2-year or 4-year, whether the school grants degrees, and whether the current year is odd-numbered or even-numbered.
For more information and step-by-step instructions on filling out the survey, see the IPEDS page on the National Center for Education Statistics website.
Step 1: Collect fall enrollment data
Follow the instructions under Part A of the Fall Enrollment survey to determine whether to report enrollment as of your institution's official fall reporting date, as of October 15, or for any students enrolled between August 1 and October 31.
Then, prepare a Students list to fill out Part A:
1. In Academics, go to Attendance and select Students list.
2, Select Columns.
|
3. Choose the following columns to appear on the list:
|
|
When you are finished, select Apply changes.
4. You now have a student list with columns that can be used to fill in Part A of the Fall Enrollment survey. You will use this list again in Step 2, so select Save and give it a name.
As you fill out Part A, use Filters to generate lists relevant to each section.
|
The labels may vary according to your school's settings, but here is an example of the filters a school might use to generate a list to fill in Fall Enrollment for Full-Time Undergraduate Students:
|
|
Select Apply filters, then filter or sort by the Gender column to fill in the survey sections for Men and Women.
Note: Refer to the IPEDS documentation for guidance on reconciling gender counts to overall student totals.
5. Depending on the number of students enrolled at your school, you may be able to use the list in your browser to drill down and find the student counts.
Use the Filters button to narrow down the list, and select the header of any column to sort the list by that column in ascending or descending order. Bear in mind that if the list overflows a single page, you can use the left and right arrows or select a page number at the bottom of the list.
If your school has a large number of students, you might find it easier to download the list and open it with spreadsheet software such as Microsoft Excel. To do this, select Export. The list will save as a CSV file in your internet browser's Downloads folder.
Depending on your school's fall reporting date and when you are filling out the survey, you may need to use the Enroll date column to either sort the list chronologically (within the Students list in your browser) or filter for a specific timeframe (using spreadsheet software).
Step 2: Generate age and gender data
In this section, you will use another Students list to determine how many students fall within certain age ranges. You will use this list to fill in Part B of the survey.
Academic reporters must report student age as of the institution's official fall reporting date or as of October 15.
Program reporters must report student age as of August 1.
Note: This section of the survey is only mandatory during odd-numbered years.
1. Return to the Students list and open the list you created and saved in Step 1. Clear the filters.
2. Go to Columns and select the following:
-
Age
-
Date of birth
Select Apply changes.
3. There are two ways to generate a list of students organized by age.
-
If you happen to be filling in the IPEDS report on your institution's reporting date, sort by the Age column. If you are filling in the survey on any other date, you can still sort and filter by the Age column, but you will need to check each row's Date of birth column to confirm whether the student fell within the age range on the official reporting date.
-
If you are filling in the survey on a different date, sort the list by Date of birth.
4. Apply filters as needed for first-time students and undergraduate student classifications. Use this list to fill in Part B.
Note: Refer to the IPEDS documentation for guidance on reconciling gender counts to overall student totals.
Step 3: Generate state residency data
In order to fill in Part C (Residence of First-Time Undergraduates), you will return to the Students list and add a column to display students' home states and countries.
Note: This section of the survey is only mandatory during even-numbered years.
1. Return to the Students list and open the list you created and saved in Step 1. Clear the filters.
2. Go to Columns and select the following:
-
State
-
Country
Select Apply changes.
3. Select the column headers to sort the list by Country, then by State. Apply filters as needed for first-time students and undergraduate student classifications. Use this list to fill in Part C.
Step 4: Calculations
For Parts D through F, you will make calculations based on data you already entered in this year's IPEDS survey, data you entered in last year's survey, and faculty information provided by your institution's human resources department.
Graduation Rates
The Graduation Rates component of the IPEDS survey collects data on a cohort of full-time, first-time undergraduate students. The main question it seeks to answer is: How many students in a cohort complete the program within 150 percent of the normal completion time? For example, in a cohort of students seeking a 4-year bachelor's degree, you will report how many of those students completed the degree within 6 years.
Note: Reporting requirements vary depending on whether a school offers a 4-year, 2-year, or less-than-2-year program, and on whether you are an academic reporter or a program reporter. For more information and step-by-step instructions on filling out the survey, see the IPEDS page on the National Center for Education Statistics website.
Step 1: Prepare your cohort data
If your school has prepared IPEDS reports using Blackbaud Education Management in the past, students might already have cohort data attached to their profiles. If not, you can add the relevant data to their profiles and then use a Students list to report graduation rates by cohort year and sub-cohort.
To edit cohort data for an individual student:
1. In Core, use the People finder to open a student's profile. Open the Contact Card tab.
2. Find the General information tile and select Edit.
|
3. Make sure that the student has accurate information in the following fields:
|
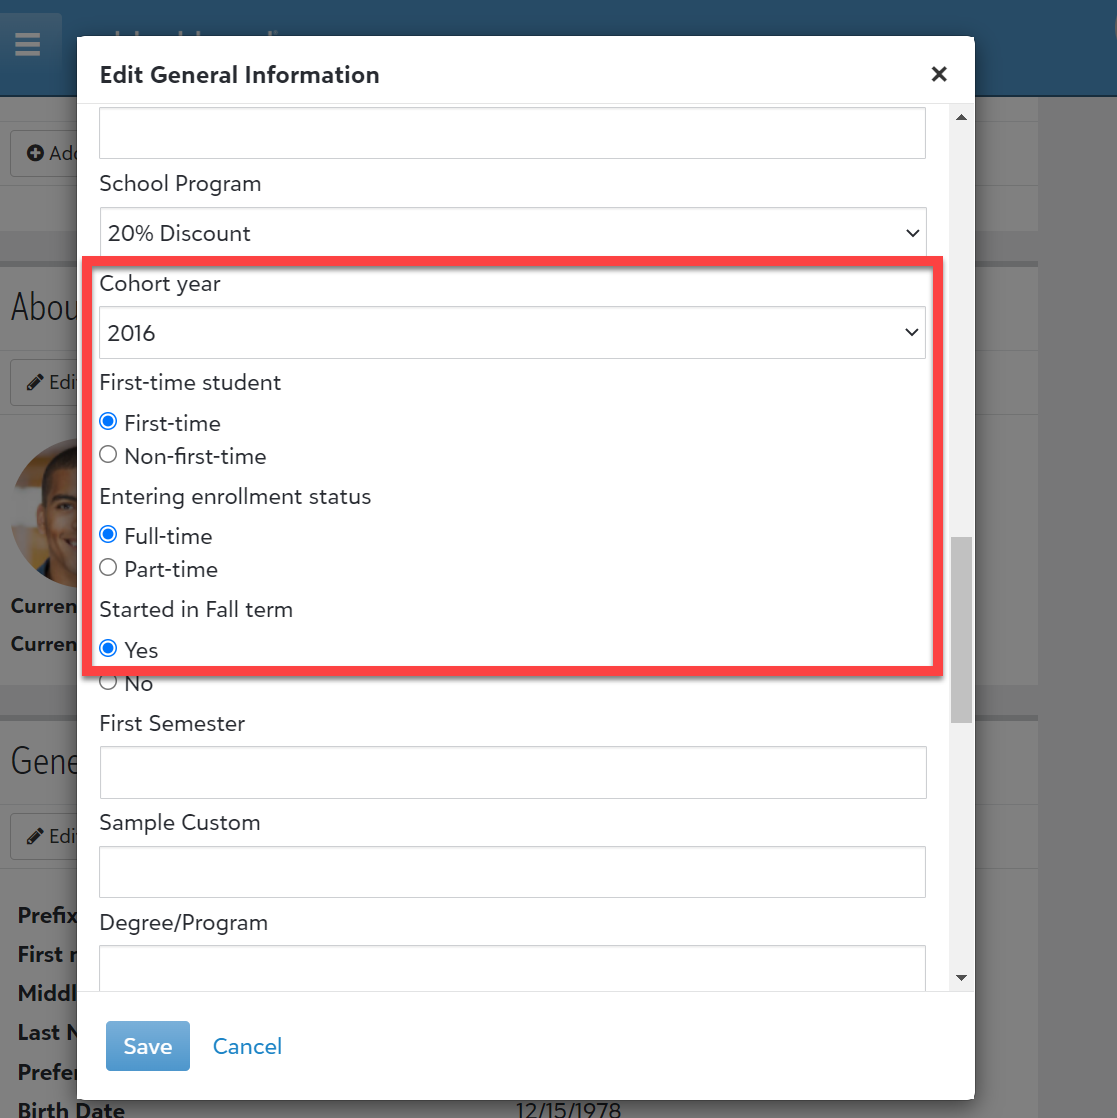
|
Tip: Depending on your school's data needs, an administrator can set up sub-cohorts such as "Bachelor's seeking students" and "Other (Associate's degree, etc.)." To create sub-cohorts in Core, go to Settings, General settings, and then Custom fields. See the help topic Custom User Fields for more information.
4. Select Save when you are finished.
To edit cohort data in bulk:
|
1. In Core, select System tools, then Data import. 2. Select Create import job. 3. Select the following:
4. Give the import a Name. |
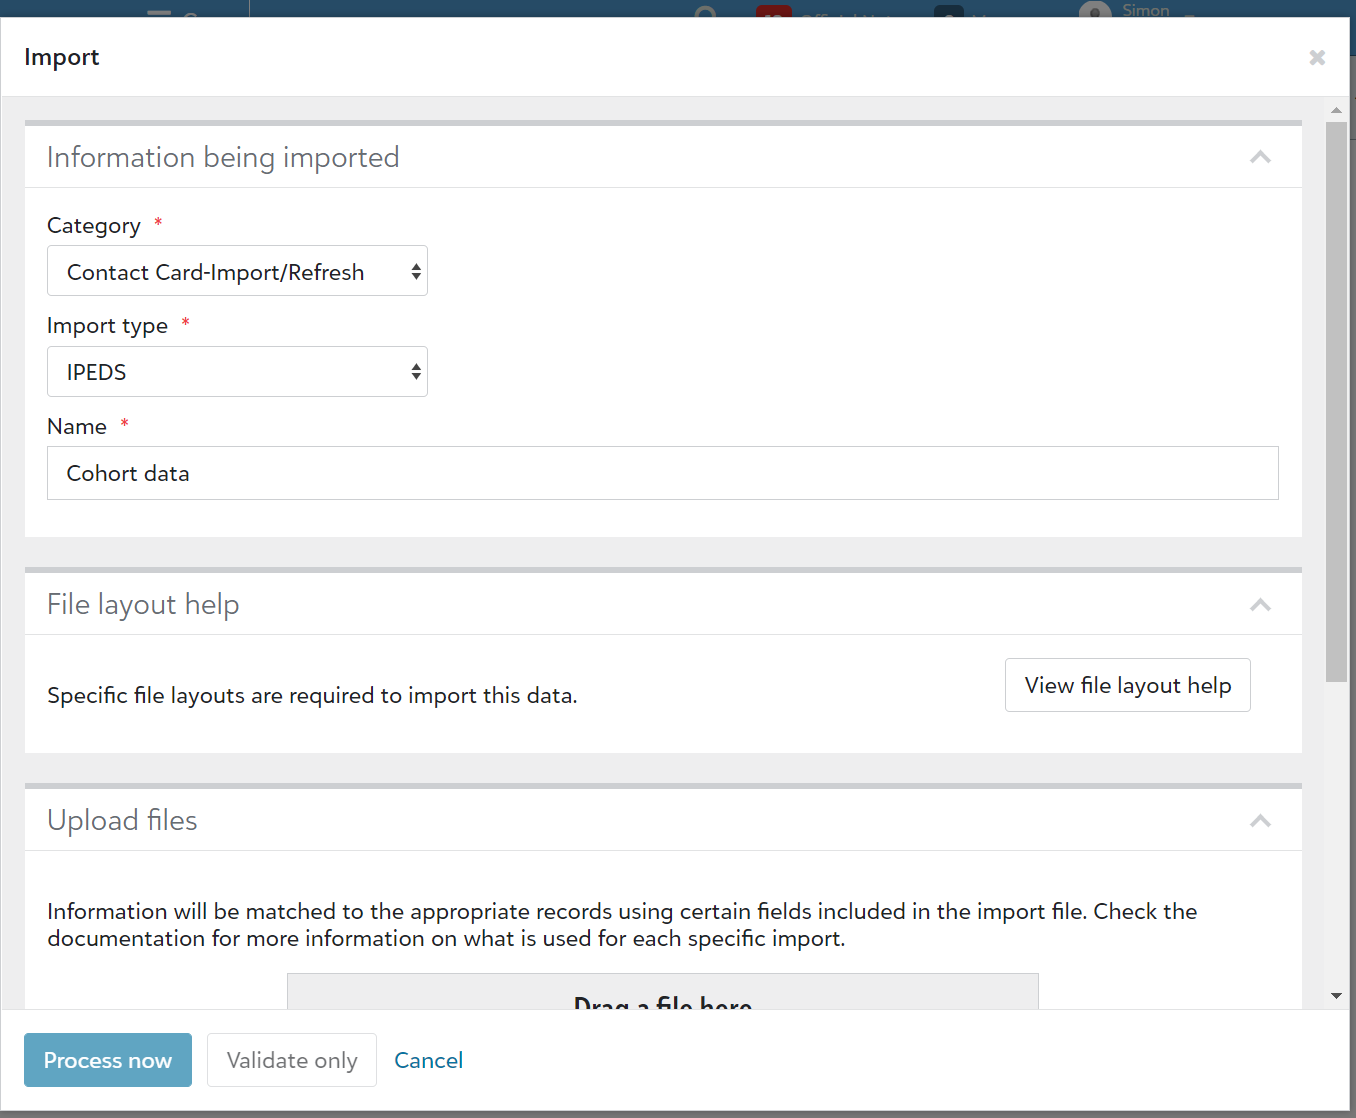
|
5. Select View file layout help for more instructions. Here you can download a sample file with the required fields and then edit it using spreadsheet software.
6. Select Cancel to return to the Data import screen. Upload your completed spreadsheet or drag into the Drag a file here box.
7. Select Process now.
Step 2: Create a student list for each cohort
1. In Academics, go to Attendance and select Students list.
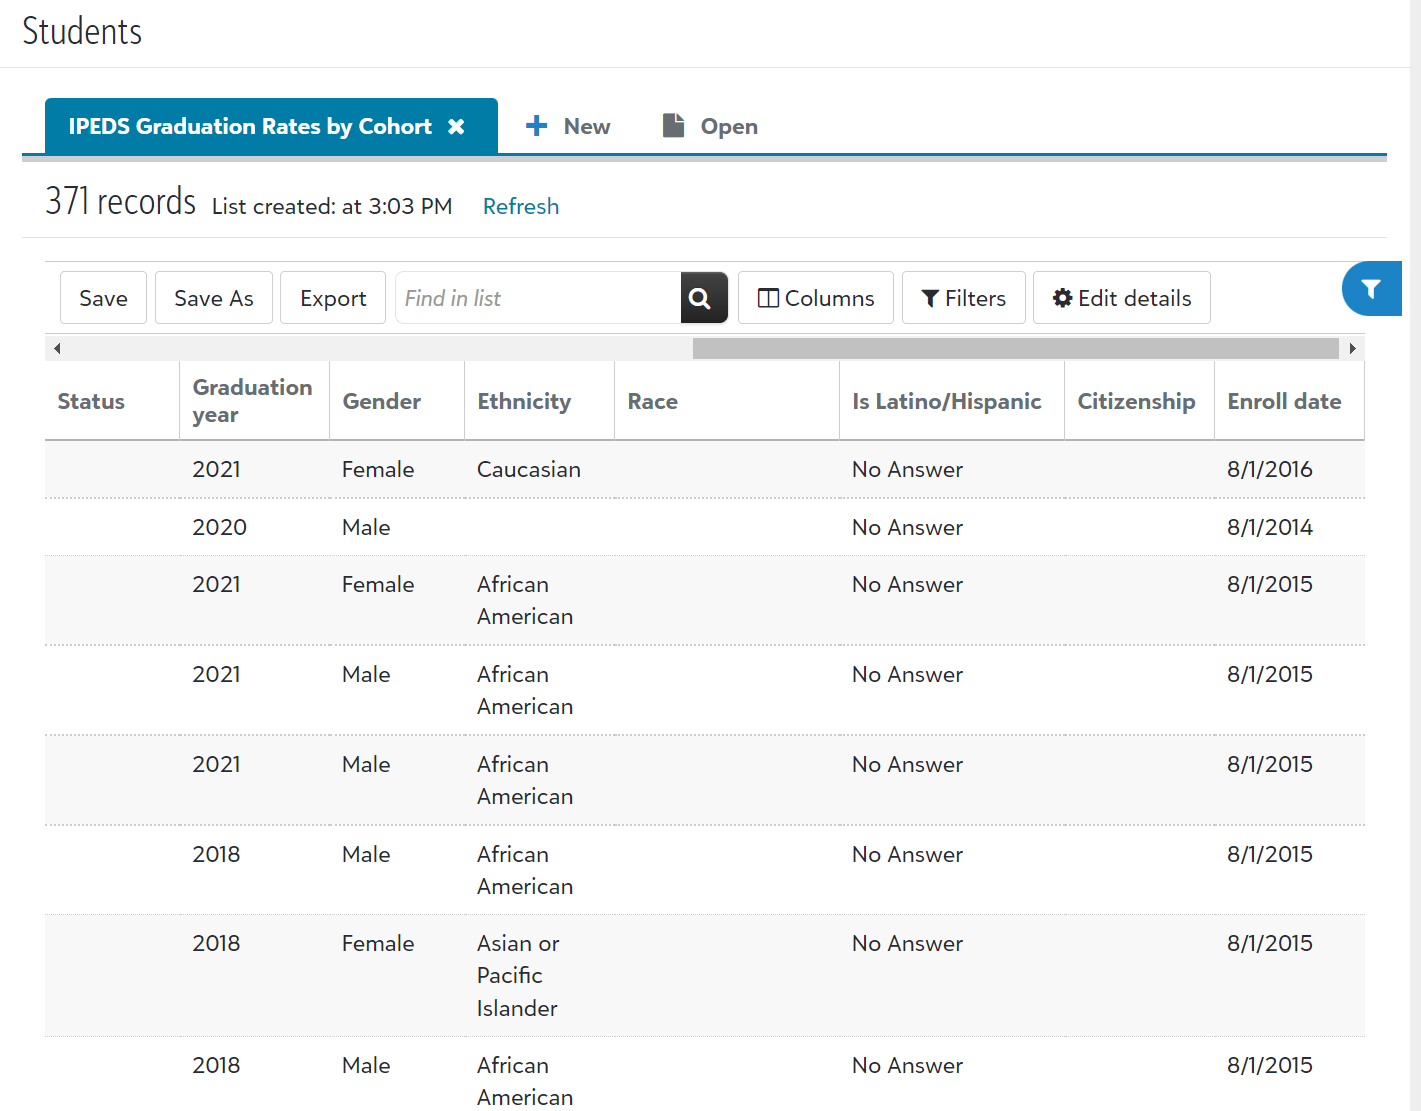
2. Go to Columns and select the following:
-
Student summary
-
Cohort year
-
First-time student
-
Started in Fall Term
-
Enrollment Status
-
Enroll date
-
Graduation year
-
Withdrawal reason
-
Gender
-
Ethnicity
-
Race
-
Is Latino/Hispanic
-
Citizenship
If your school has set up sub-cohort fields for student contact cards, select those fields as well. Select Apply changes when you are finished.
3. Now, you will need to filter this list to only display students from the relevant cohort. For example, if you are reporting graduation rates for a 4-year bachelor's degree, select the cohort from 6 years ago. If you are reporting graduation rates for a 2-year associate's degree, select the cohort from 3 years ago, and so on.
If you would like to view the cohort within your browser window, select the Cohort year column header to sort the list chronologically, then scroll to find the relevant cohort year.
If you would like to view the cohort in a spreadsheet, select Export to download the list as a CSV spreadsheet file. Open it in your spreadsheet software and filter the Cohort year column to only display students from the relevant cohort year.
4. You now have a list of students from a cohort with all of the relevant data for filling in the Graduation Rates survey. Be careful to read the instructions on the IPEDS form. For example, if the form tells you to exclude part-time students from a cohort, you can filter the list by the Student status column to only display full-time students.
Note: Refer to the IPEDS documentation for guidance on reconciling gender counts to overall student totals.
5. If you would like to save the list settings for future reference (for example, in completing the Graduation Rates 200 survey), select Save and give it a Name.
Graduation Rates 200
The Graduation Rates 200 component of the IPEDS survey is similar tot he Graduation Rates component. It collects data on a cohort of full-time, first-time undergraduate students. The main question it seeks to answer is: How many students in a cohort complete the program within 200 percent of the normal completion time? For example, in a cohort of students seeking a 4-year bachelor's degree, you will report how many of those students completed the degree within 8 years.
To complete the Graduation Rates 200 component, follow the steps listed above for Graduation Rates, but use a 200% cutoff instead of a 150% cutoff.
Note: Reporting requirements vary depending on whether a school offers a 4-year, 2-year, or less-than-2-year program, and on whether you are an academic reporter or a program reporter. For more information and step-by-step instructions on filling out the survey, see the IPEDS page on the National Center for Education Statistics website.
Outcome Measures
The Outcome Measures (OM) component of IPEDS collects award and enrollment data from degree-granting institutions on 4 undergraduate cohorts and 8 undergraduate sub-cohorts. You will need to collect data at 3 status points: 4 years, 6 years, and 8 years after entry.
Note: For more information and step-by-step instructions on filling out the survey, see the IPEDS page on the National Center for Education Statistics website.
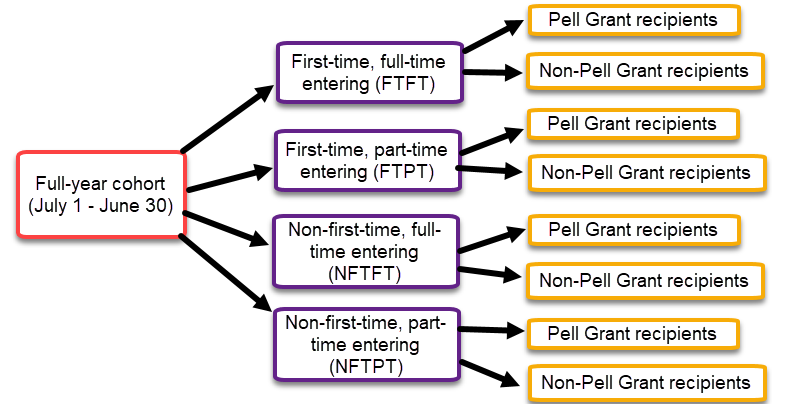
To start, you will need to identify the entering degree- or certificate-seeking undergraduate students for the full year listed on the Outcome Measures survey. This will be a group of students who entered 8 years ago.
You will then break this group of undergraduates down into 4 cohorts based on their status when they enrolled:
-
First-time, full-time entering (FTFT)
-
First-time, part-time entering (FTPT)
-
Non-first-time, full-time entering (NFTFT)
-
Non-first-time, part-time entering (NFTPT)
You will then break down each cohort into two groups: Pell Grant recipients and Non-Pell Grant recipients. In the end, each student will be sorted into one of 8 sub-cohorts.
Step 1: Prepare your cohort data
If your school has prepared IPEDS reports using Blackbaud Education Management in the past, students might already have cohort data attached to their profiles. In that case, you can skip to Step 2: Establish the Cohorts.
If your school has not attached cohort data to student profiles yet, you can add the relevant data to their profiles either one at a time or in bulk.
To edit cohort data for an individual student:
1. In Core, use the People finder to open a student's profile. Open the Contact Card tab.
2. Find the General information tile and select Edit.
|
3. Make sure that the student has accurate information in the following fields:
|
|
Tip: Depending on your school's data needs, an administrator can set up sub-cohorts such as "Bachelor's seeking students" and "Other (Associate's degree, etc.)." To create sub-cohorts in Core, go to Settings, General settings, and then Custom fields. See the help topic Custom User Fields for more information.
4. Select Save when you are finished.
To edit cohort data in bulk:
|
1. In Core, select System tools, then Data import. 2. Select Create import job. 3. Select the following:
4. Give the import a Name. |
|
5. Select View file layout help for more instructions. Here you can download a sample file with the required fields and then edit it using spreadsheet software.
6. Select Cancel to return to the Data import screen. Upload your completed spreadsheet or drag into the Drag a file here box.
7. Select Process now.
Step 2: Establish the Cohorts
Next, you will create lists of students in each cohort and sub-cohort for the relevant reporting year.
1. In Academics, go to Attendance and select Students list.
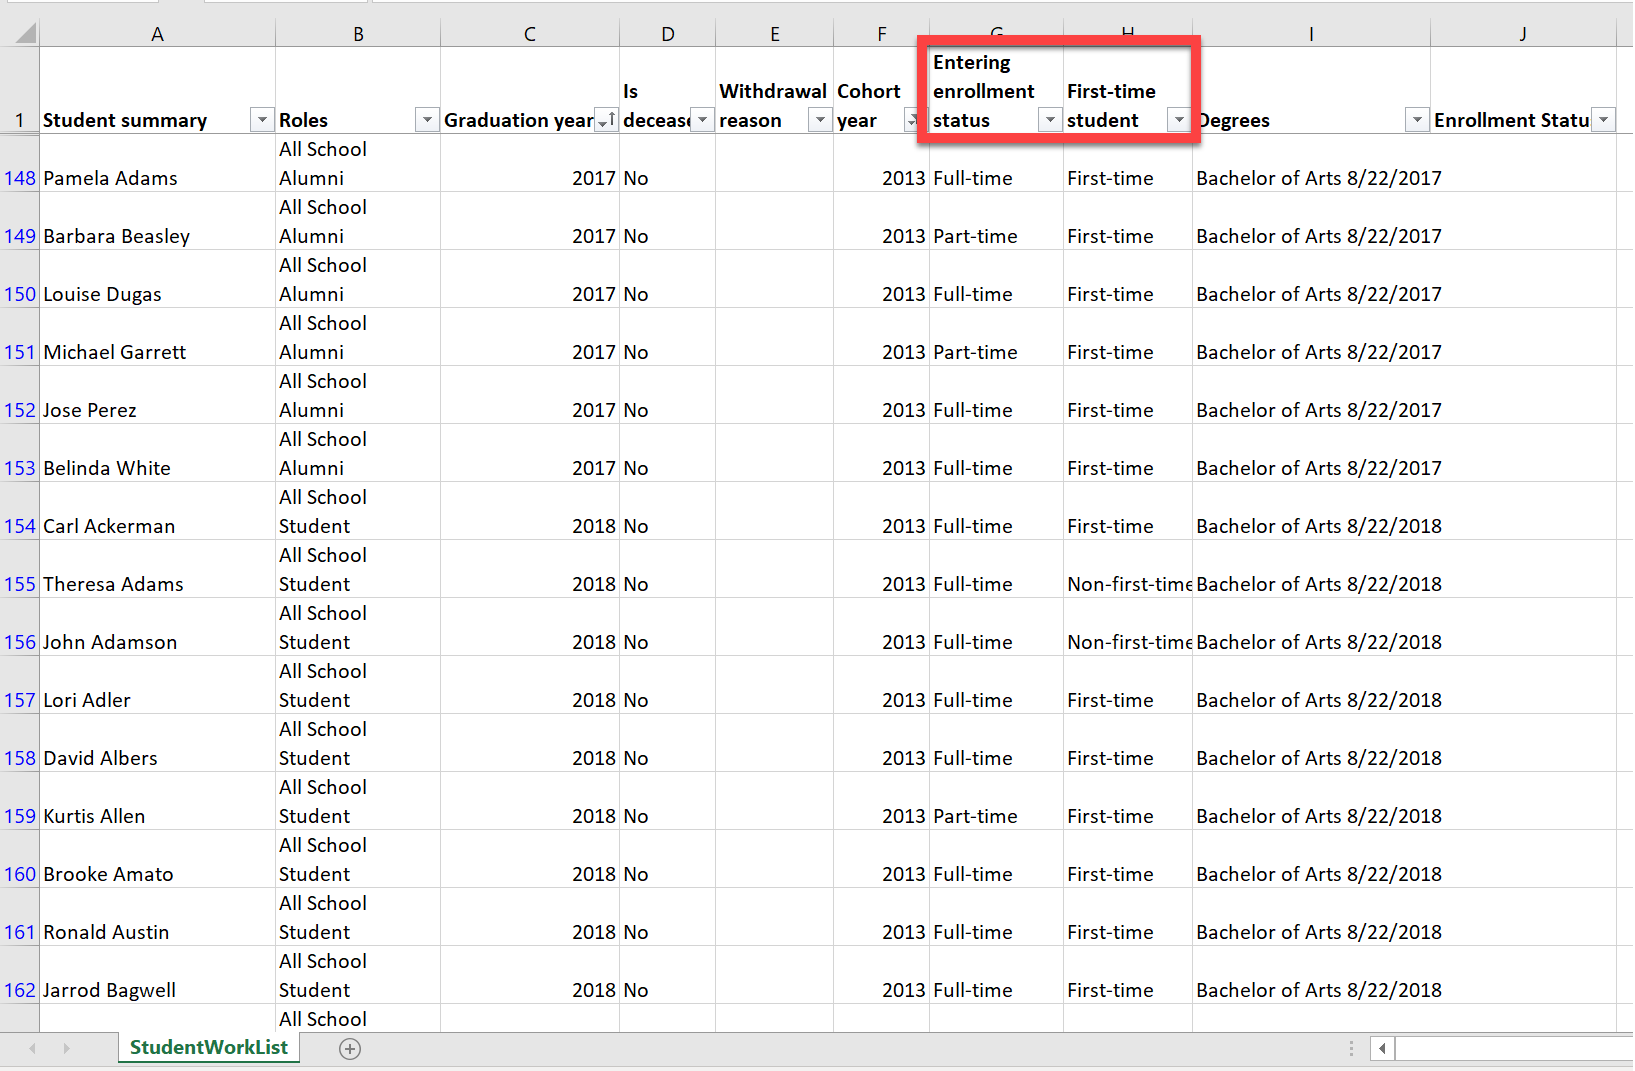
2. Select Columns, then choose the following column headers:
-
Student summary
-
Roles
-
Cohort year
-
First-time student
-
Entering enrollment status
-
Degrees
-
Enrollment status
-
Graduation year
Tip: Depending how your school has set up student profiles, you may have some custom fields to include as columns on this list, such as sub-cohort identifiers. You may also have some fields that can help you identify exclusions from the cohort, such as Withdrawal reason or Is deceased. Add those columns to the list as needed.
When you are finished, select Apply changes.
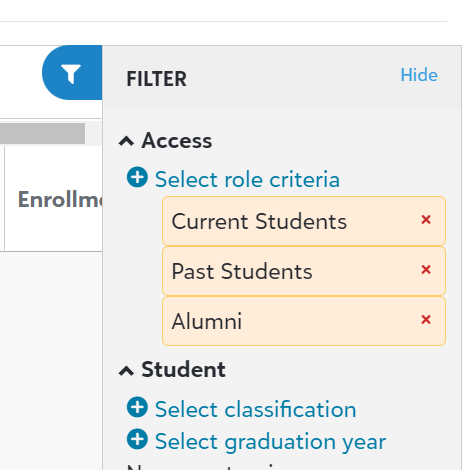
|
3. By default, the Students list only displays current students. Since you will also be reporting on students who have graduated or withdrawn, you will need to change this filter setting. Select Filters. Under Access, click + Select role criteria. Choose Current students, Past students, and Alumni, then Select. Scroll down and select Apply filters. |
|
4. Select Export to download the list as a CSV spreadsheet file. The file will appear in your internet browser's Downloads folder.
5. Open the CSV file using your spreadsheet software of choice.
Now you have a list of current students, past students, and alumni. In order to complete the Outcome Measures report, you will need to narrow the list down to only the cohort year indicated on this year's Outcome Measures form.
Using the filter settings in your spreadsheet software, filter the Cohort year column to only display the appropriate cohort year.
6. As you fill out the Outcome Measures report, filter the list as needed using the Entering enrollment status and First-time student columns. For example, to generate a list of first-time full-time (FTFT) students, you would set the First-time student filter to First-time and set the Entering enrollment status filter to Full-time.
Consult with your school's financial aid department to determine which students are Pell Grant recipients and which students are not.
It is possible to enter Pell grant status as an admin-only field on each student's profile. For more information on creating admin-only fields, see the help topic Custom User Fields .